 Brightstreet Group
InterSystems IRIS Cloud SQL Metrics in Google Cloud Monitoring
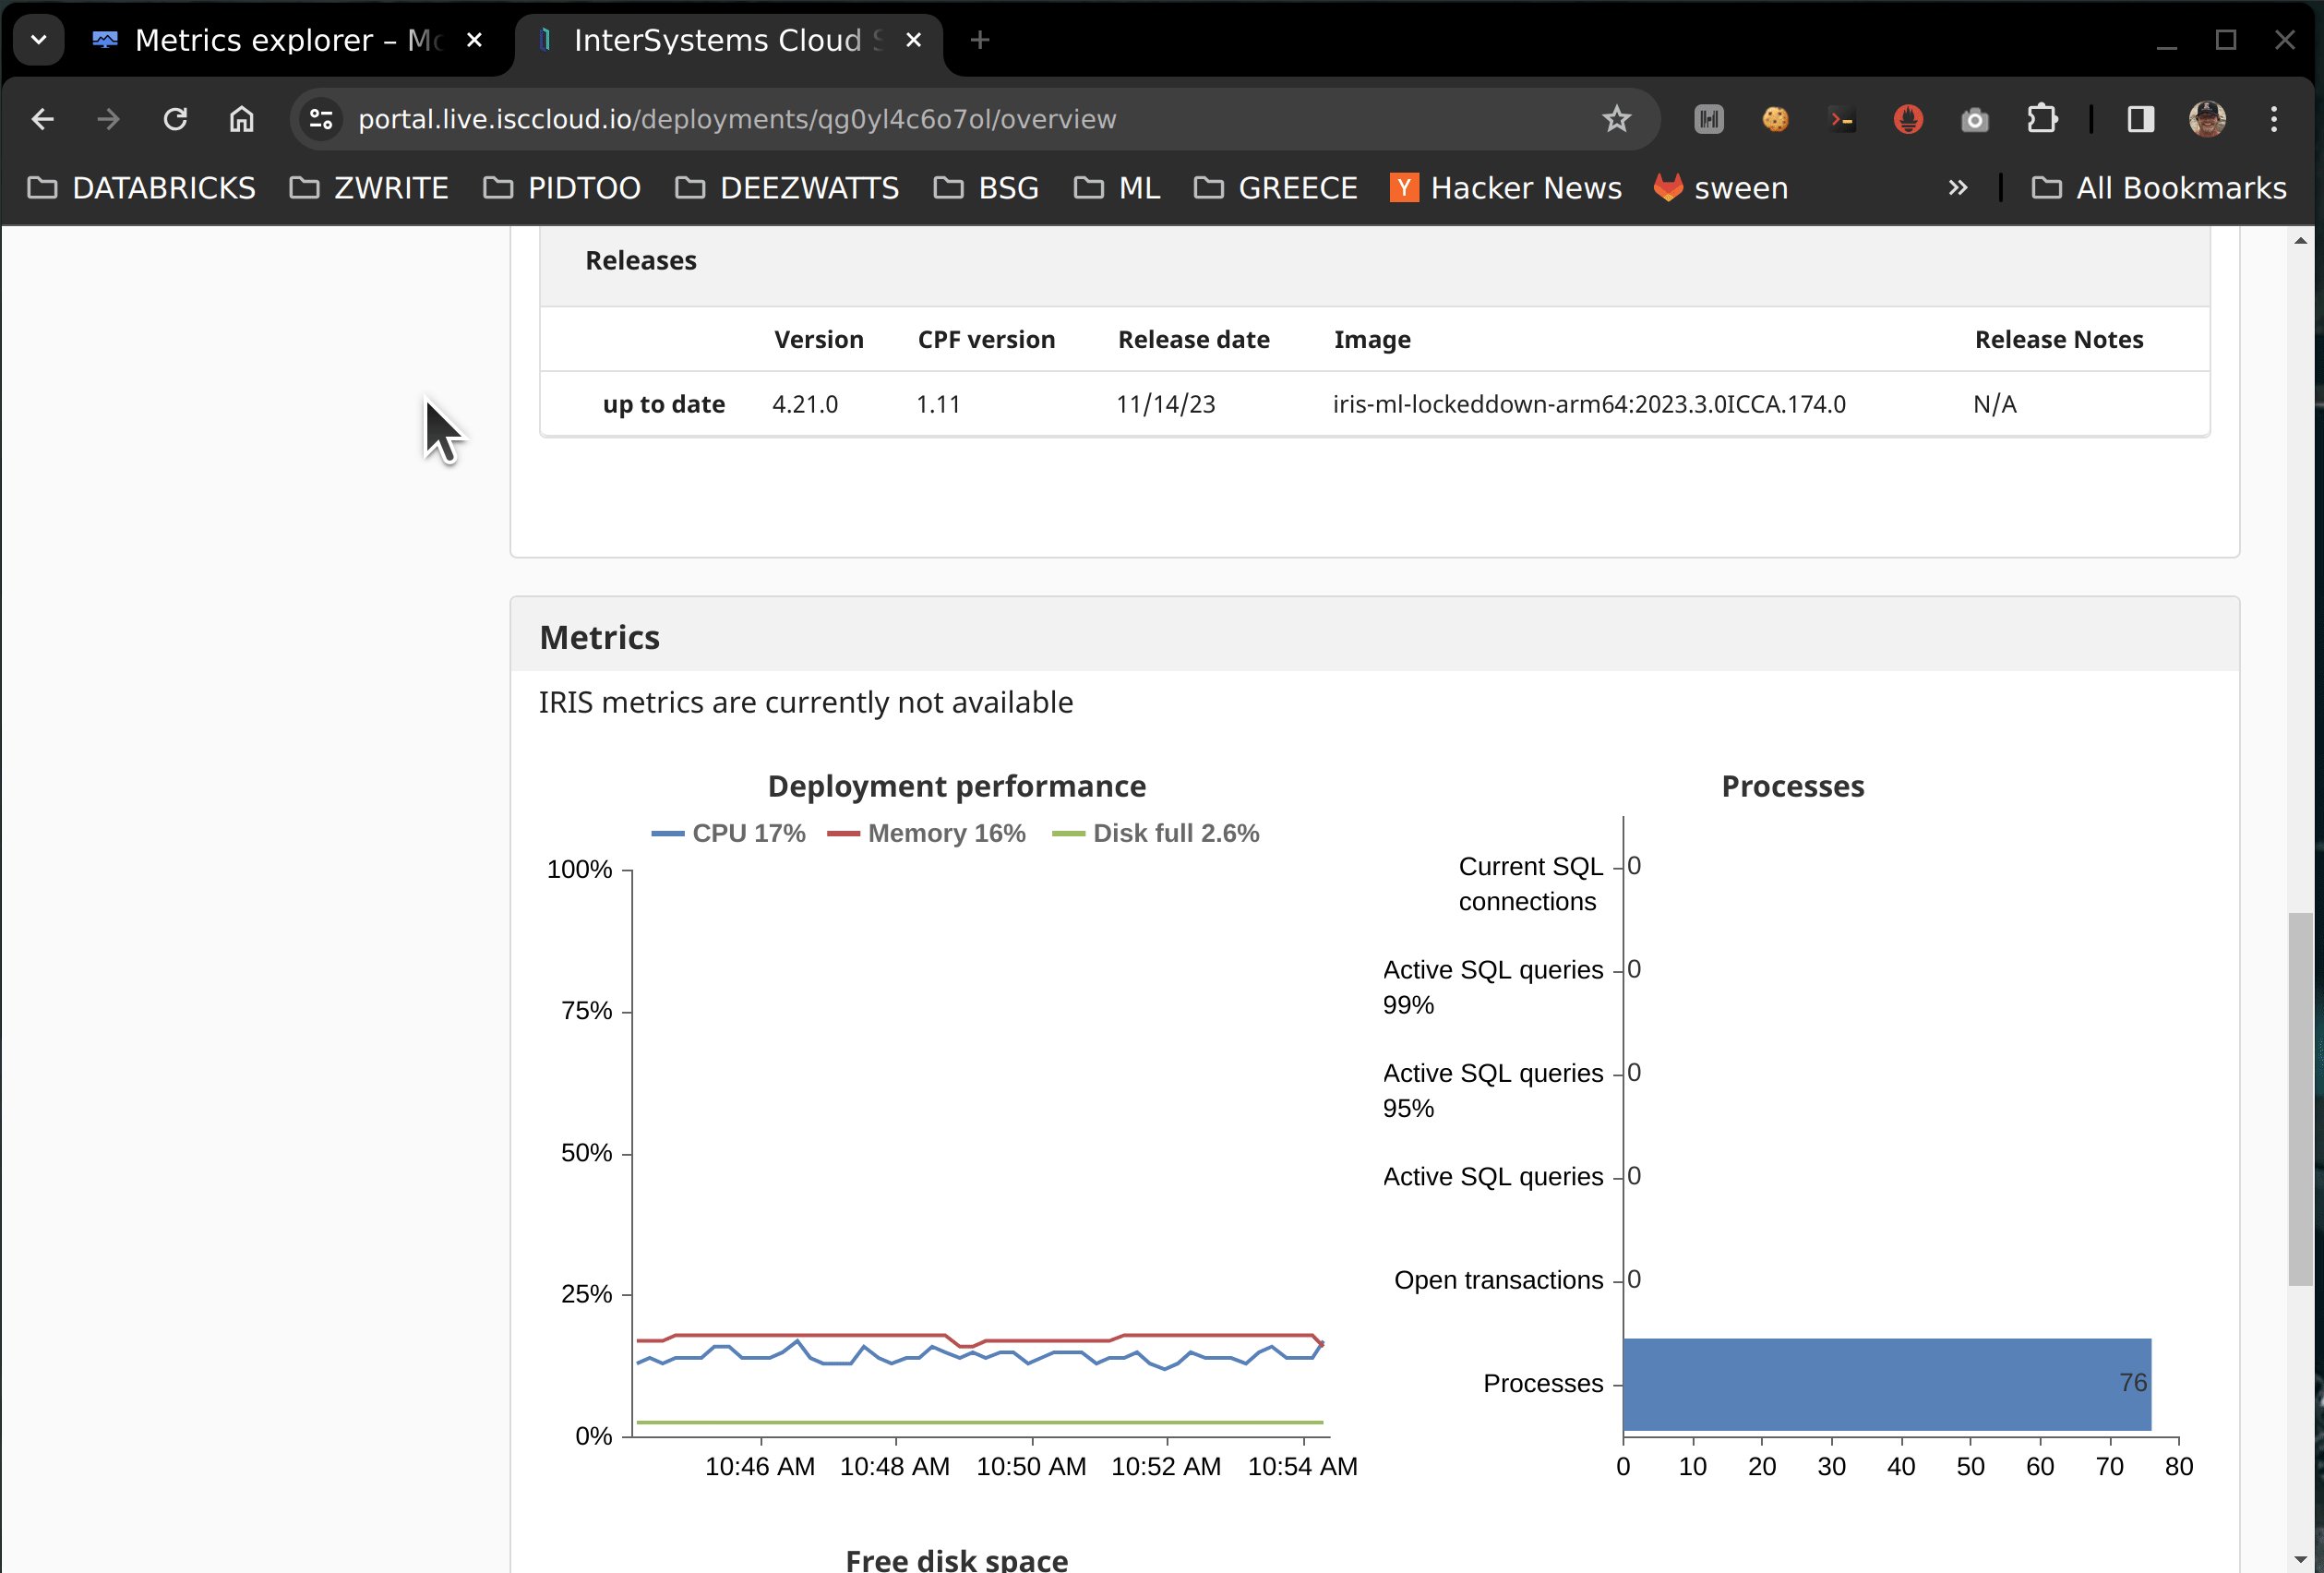
Observability is a first-class citizen in the cloud. For InterSystems Cloud SQL users on GCP, the ability to pipe performance metrics into Google Cloud Monitoring provides a unified view of your application stack. By using OpenTelemetry (OTel), we can build a robust, vendor-neutral pipeline for our database metrics.
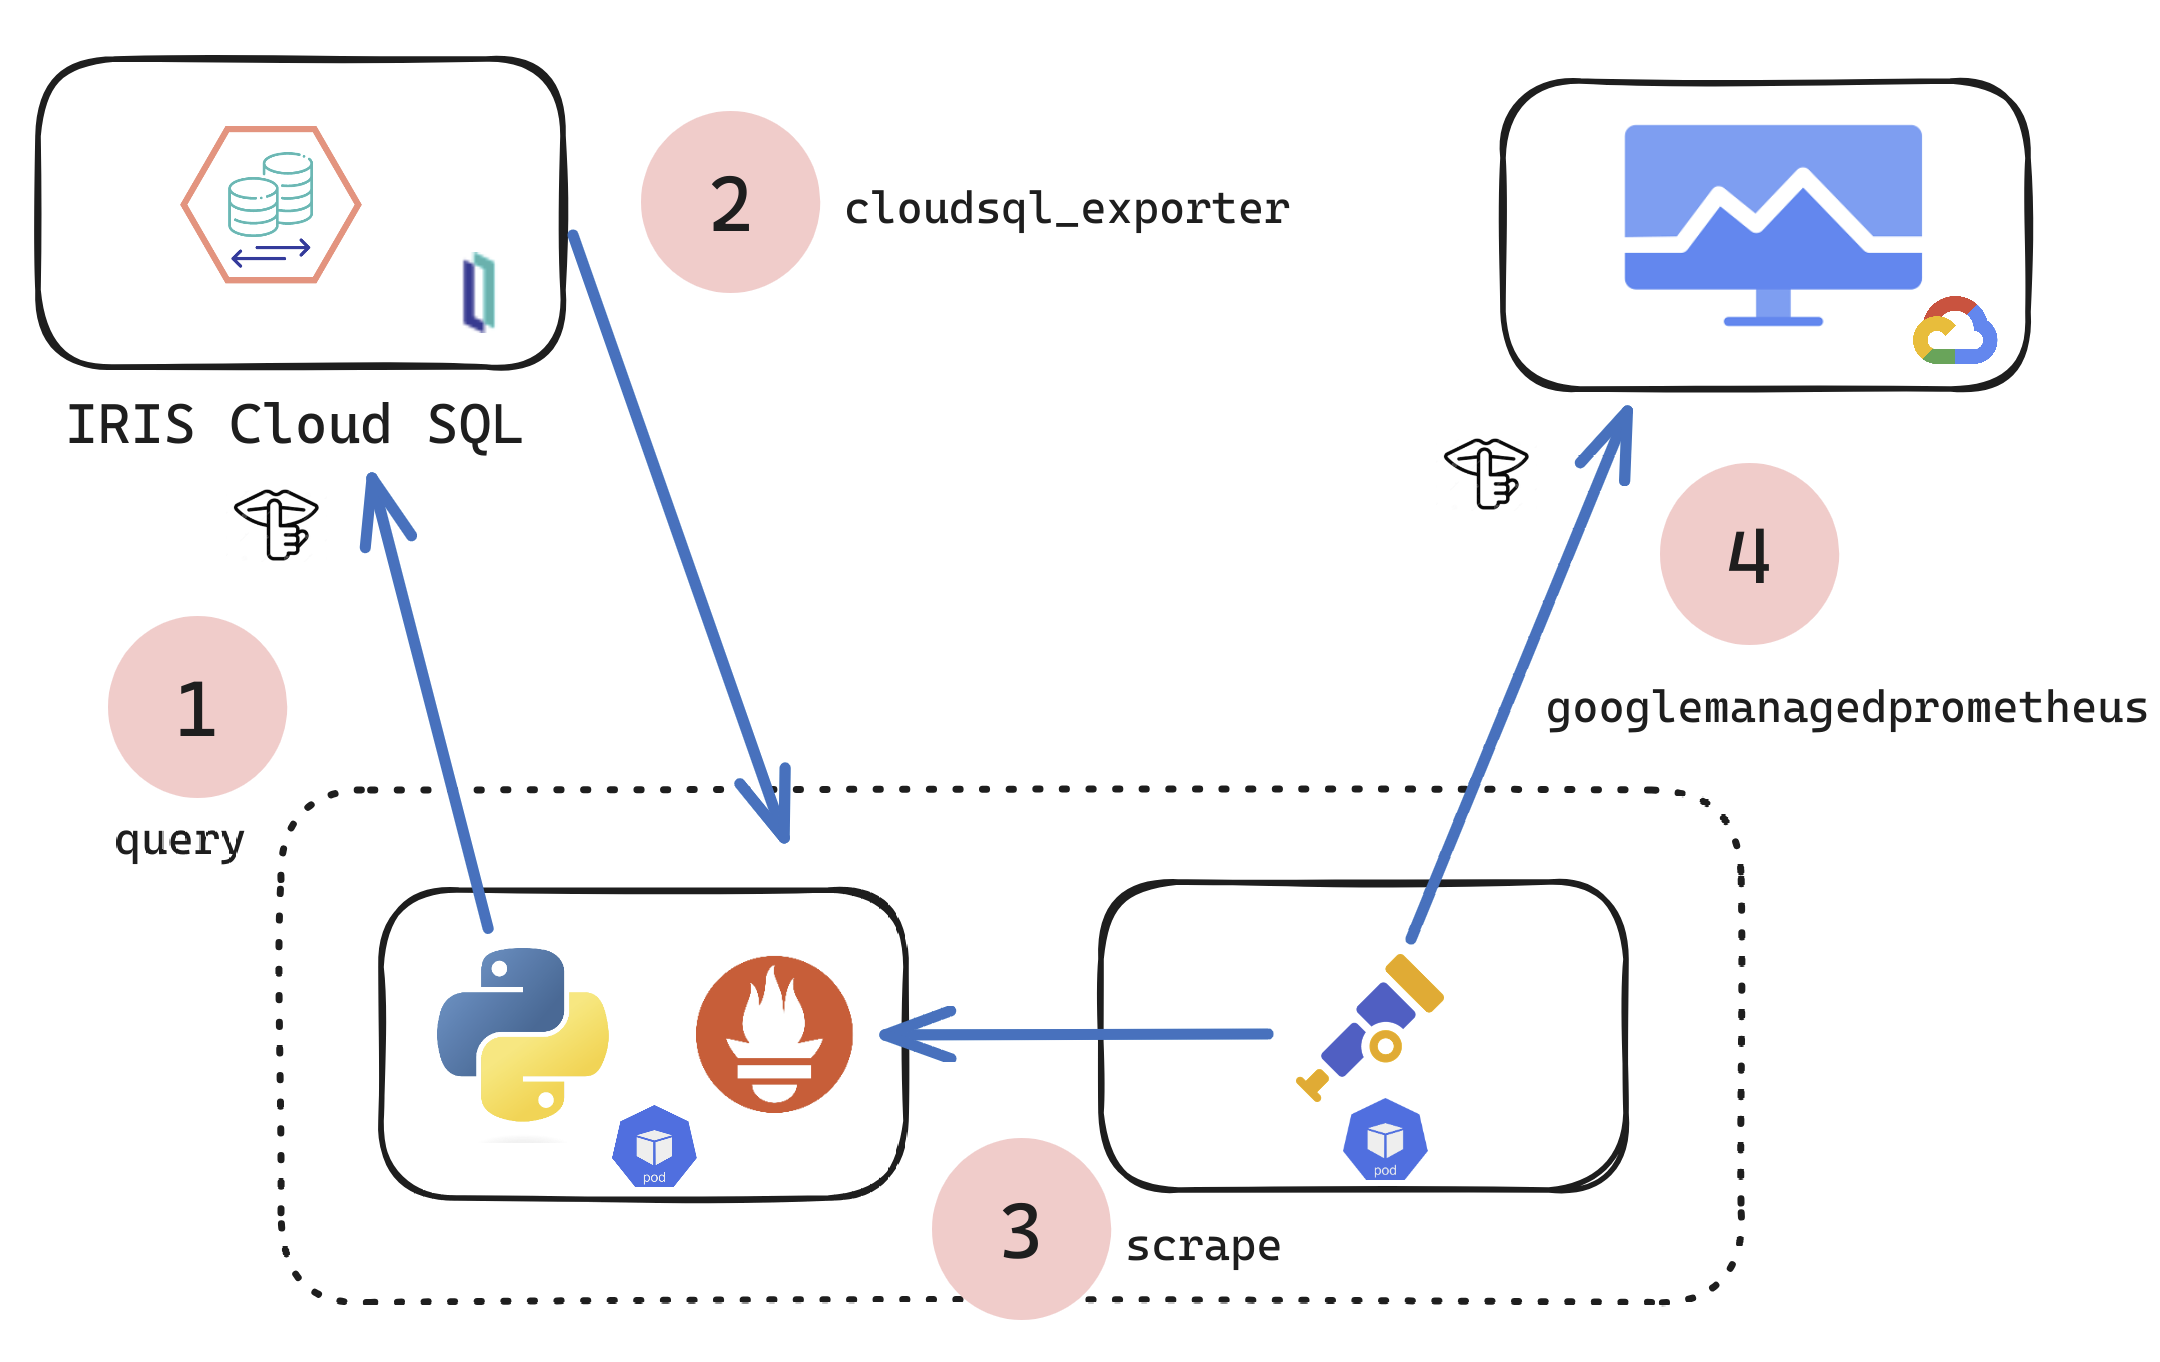
The Architecture
The solution involves an OTel collector running in Kubernetes that scrapes the InterSystems IRIS Cloud SQL metrics endpoint and pushes them to GCP’s Managed Service for Prometheus (GMP).
.png)
Setting Up the Collector
We use a sidecar or standalone deployment for the OpenTelemetry collector. The configuration defines how we authenticate with both InterSystems Cloud SQL and Google Cloud.
.png)
Authentication
For GCP, we use a service account key stored as a Kubernetes secret. For IRIS, we leverage the built-in metrics endpoint which provides Prometheus-compatible data.
Kubernetes Deployment
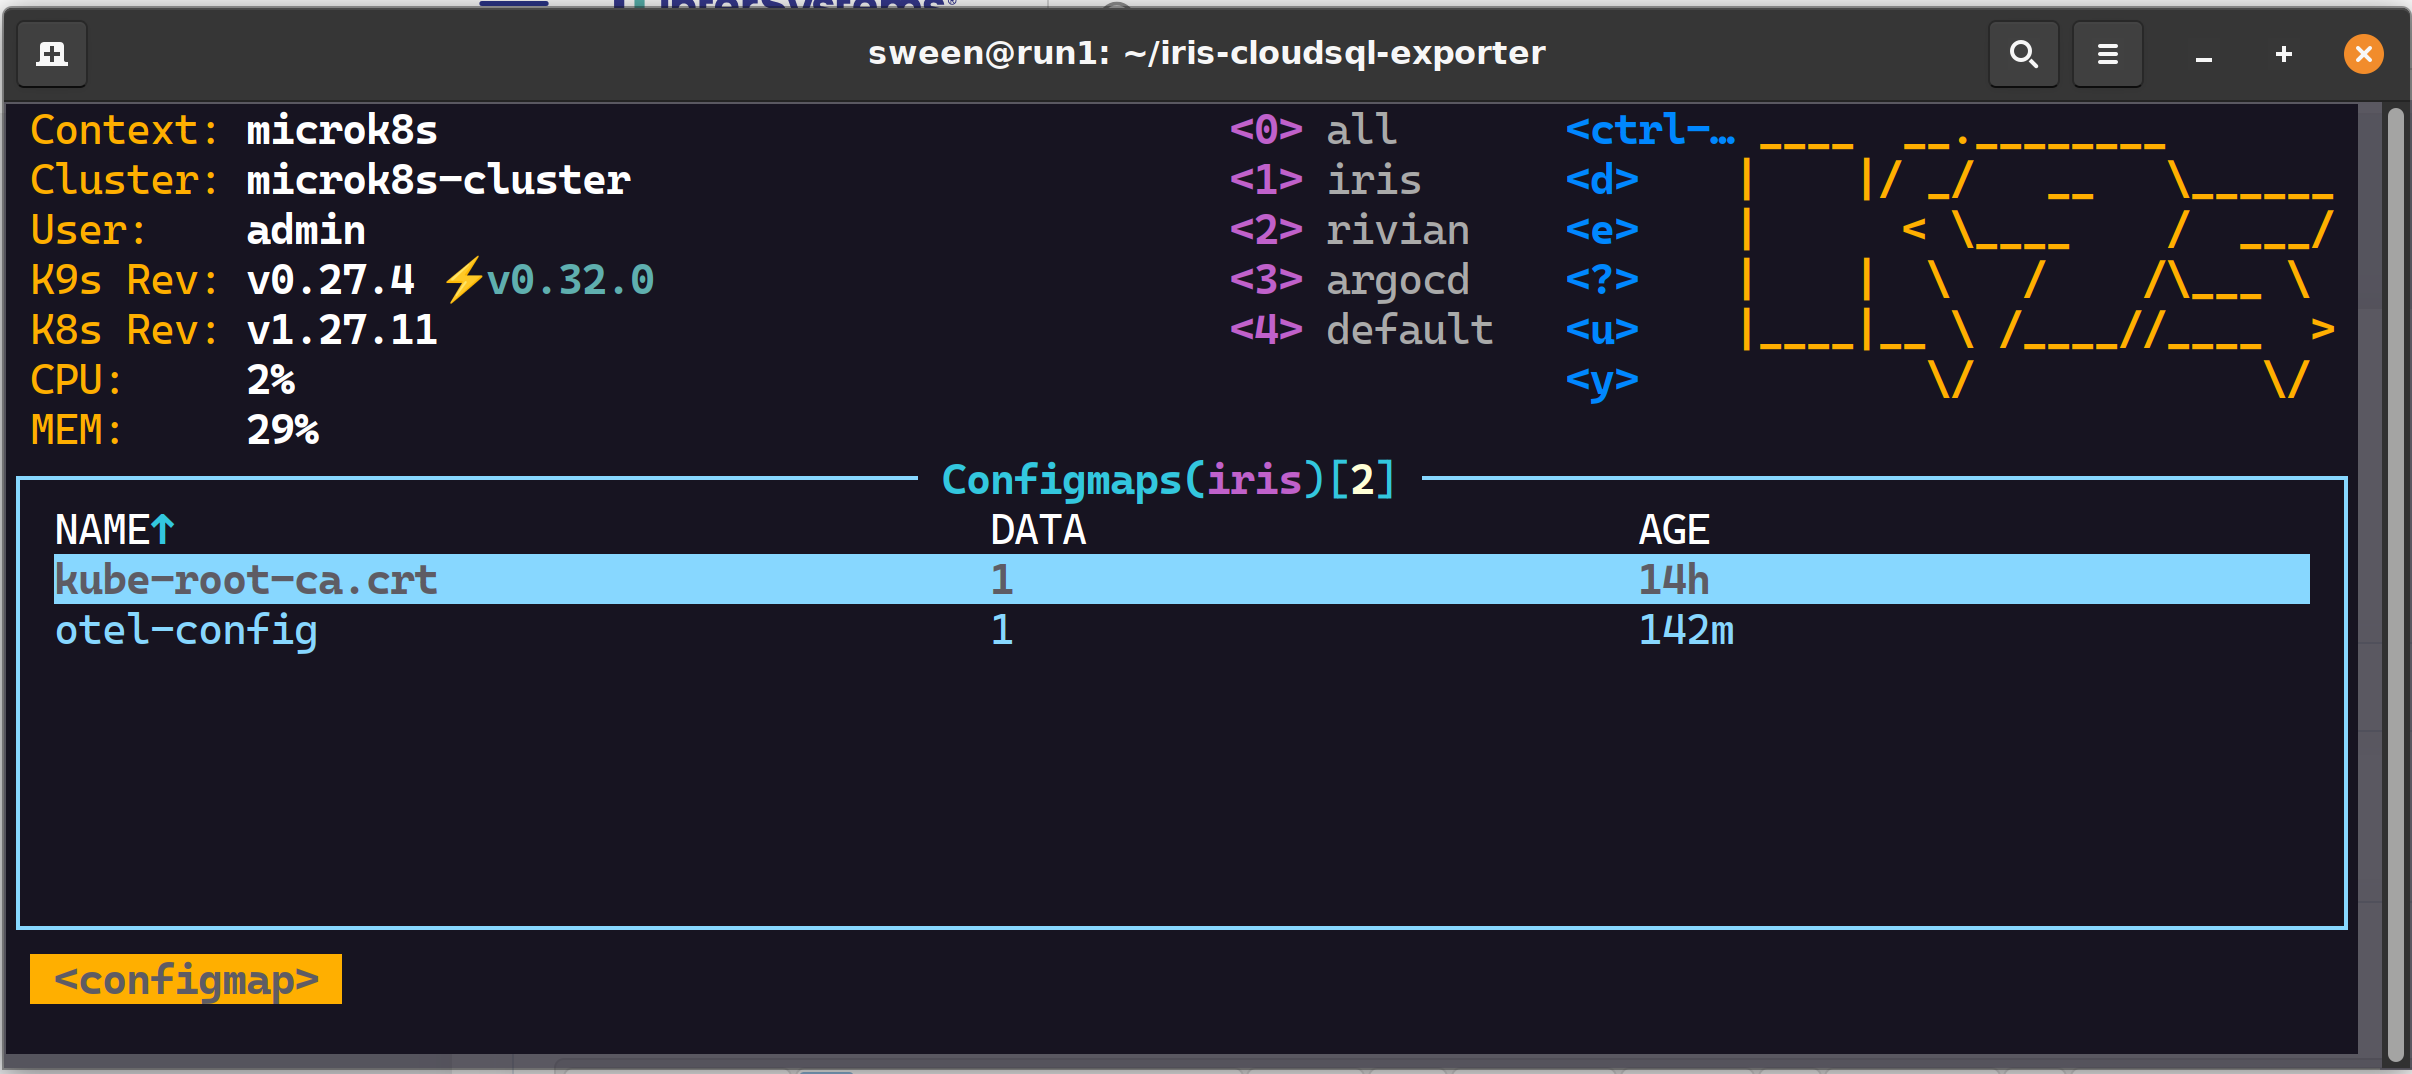
The deployment YAML orchestrates the collector and ensures it has the necessary volume mounts for configuration and credentials.
# deployment.yaml snippet
apiVersion: apps/v1
kind: Deployment
metadata:
  name: otel-collector
spec:
  template:
    spec:
      containers:
      - name: otel-collector
        image: otel/opentelemetry-collector-contrib:0.92.0
        volumeMounts:
        - name: otel-config
          mountPath: /etc/otel/
        - name: gmp-sa
          mountPath: /gmp
          readOnly: true
Verification
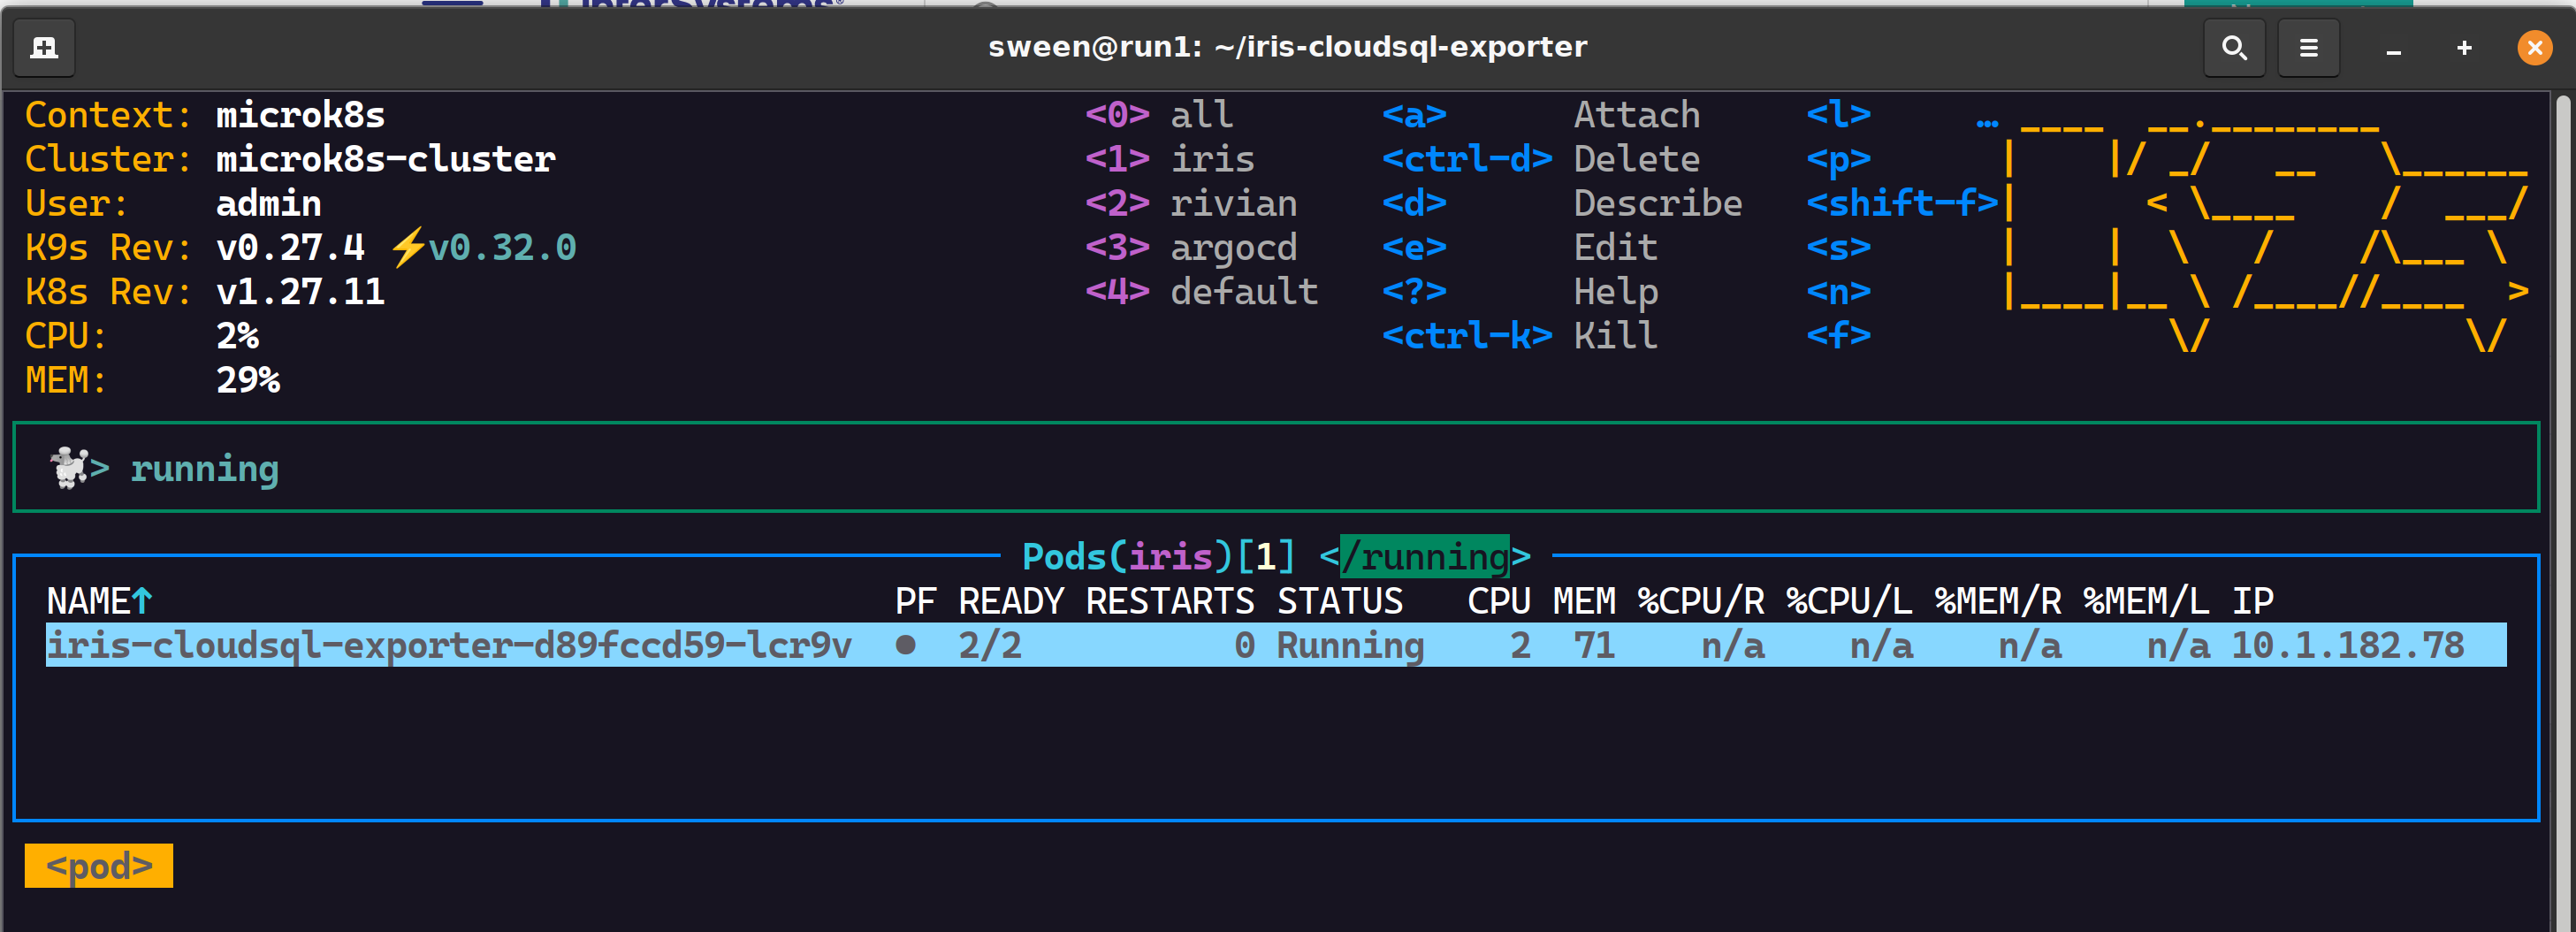
Once deployed, we can verify that the collector is successfully scraping metrics and forwarding them to GCP.
Visualizing in Google Cloud Monitoring
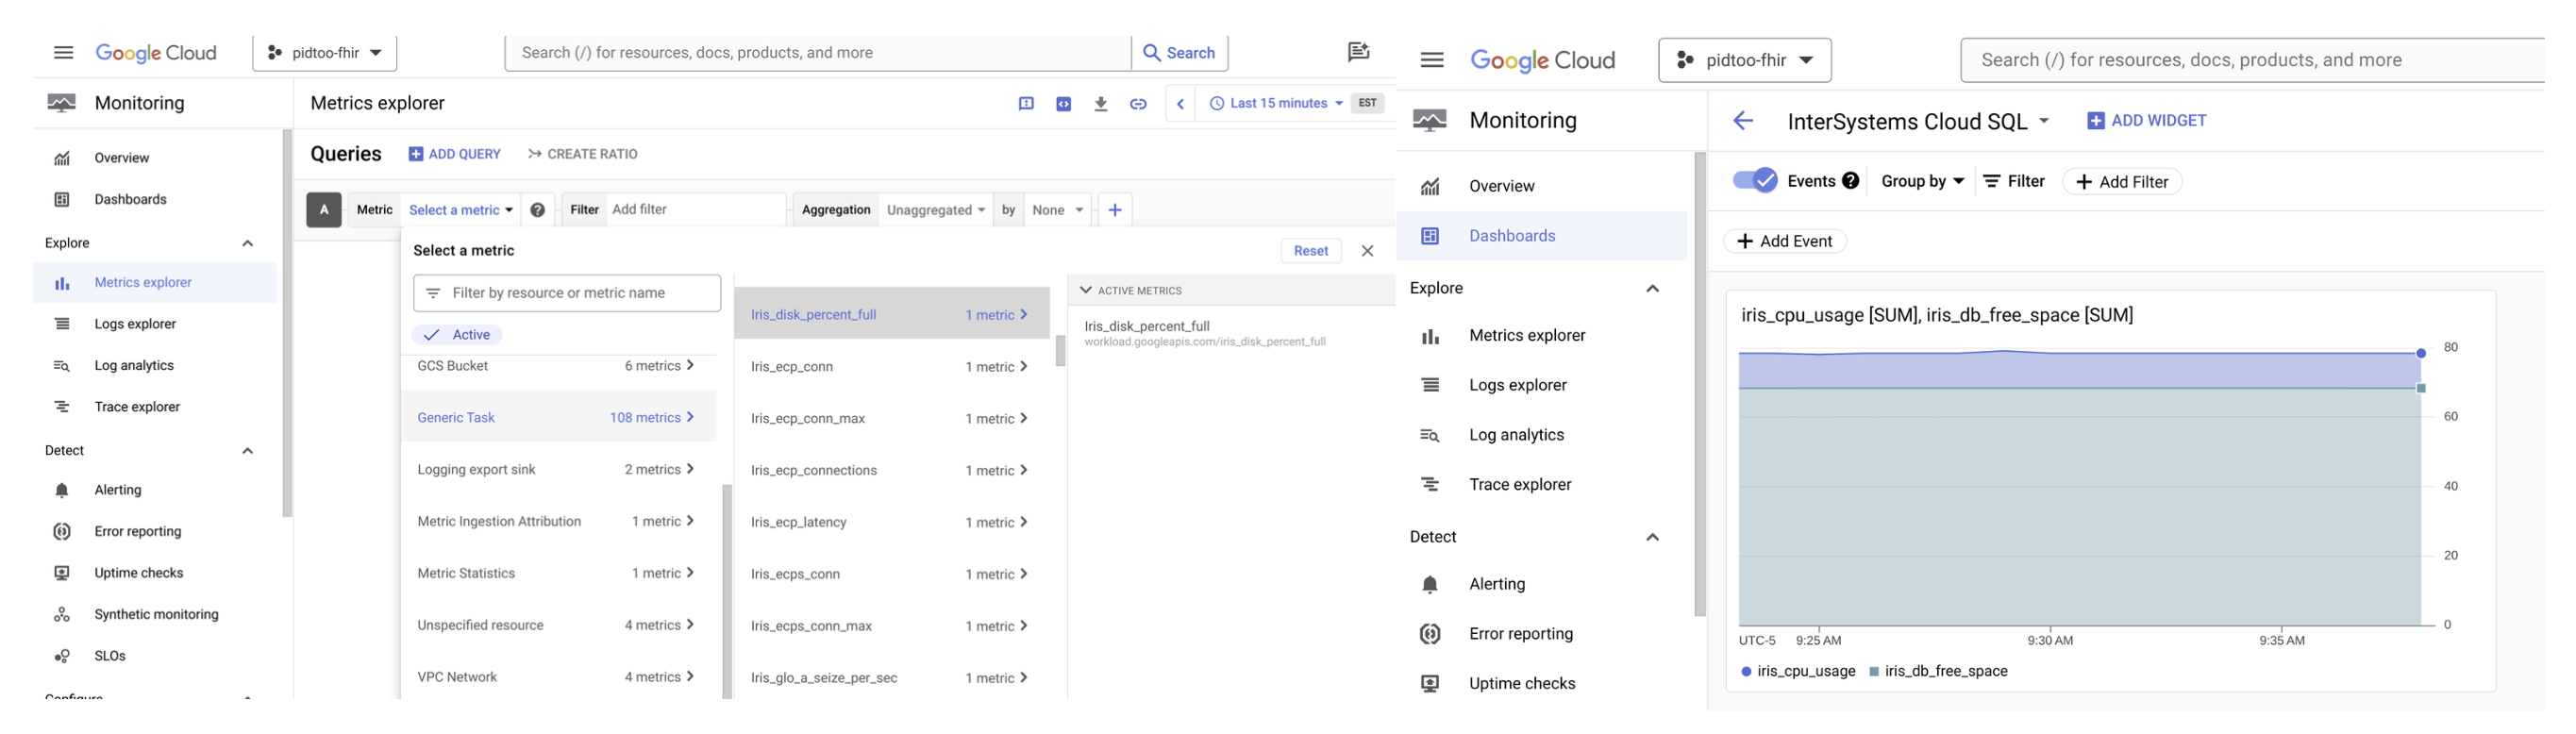
The end result is a suite of real-time dashboards within Google Cloud Monitoring, allowing you to monitor CPU usage, global references, disk I/O, and other critical IRIS metrics alongside your other cloud resources.
Conclusion
By bridging InterSystems Cloud SQL with Google Cloud Monitoring via OpenTelemetry, you gain an enterprise-grade observability platform. This integration allows for proactive alerting, deep performance analysis, and a truly unified view of your health data workloads.
Go forth and be awesome in observability!